
Climate researchers need the freedom to question widely accepted views but most find that theory isn't enough to inoculate them against the madness of millions shouting in unison - what they need is a simple, concrete, fact or illustration capable of producing a reaction sufficiently analogous to a child's response to the emperor's lack of clothes to free them to act on the facts.
From a rational and apolitical perspective it is obvious that the global climate change hysteria is grossly overwrought. The science says that atmospheric CO2 produces warming, but at a rate an order of magnitude too small to matter and both history and common sense support the idea that warmer is better than colder anyway. Unfortunately words like "rational" and "apolitical" do not describe the environment people trying to launch or maintain careers in the sciences find themselves in. What these people face, instead, is a raging torrent of uninformed opinion fed by far left idealogues whose control of the media and major funding agencies makes questioning almost any aspect of "climate science" a career ender.
As a result many geophysical and atmospheric science faculties across North America now function in a kind of "1984" world: one in which almost everyone knows the rationale for the war on carbon to be nonsense, but everyone also understands that those willing to say so soon disappear from the more prestigious faculties, conferences, and journals while weaker colleagues loudly proclaiming the importance of research on the extent to which CO2 generated by burning fossil fuels to power the fifth light negatively affects the fluidity of fluorescence differentials in pigmented epithelials prosper mightily.
Part of the reason it's so difficult to get information about either the irreality of, or the likely positive consequences of, global warming into the public sphere is that atmospheric physics is inherently very complex and most of the people manning the gateway between science and the public (aka "the media") are not just emotionally, politically, and financially aligned with the mob, but also generally untrained, uninformed, and, often, so socially bigoted against those who pursue science that they make themselves seem both stupid and arrogant. Just try to imagine, for example, explaining the use of Navier-Stokes tensor fields in atmospheric physics -or even just the absurdity of making (see paragraph 8, of this) 80 year predictions to six decimal places on data that is at best accurately recorded to the nearest whole unit - to "Morning Joe" or the ladies of "The View."
It isn't just the combination of complexity with abstraction: the biggest part of the problem for media people is that the need for political correctness leads to information corruption coupled with information refusal: they think they know, but what they know is mostly wrong and explanations crash uselessly into walls of willed ignorance. Try telling almost any western reporter what the polar bear's abject failure to go extinct during the medieval warming period means in terms of today's hysteria about a hypothetical 3 degree warming by 2100 AD and you'll get an over-the-top emotional rejection, not the commitment to research and thought you'd expect from a rational person - tell that same reporter that the dark ages largely resulted from the loss of agricultural productivity brought on by the end of the late Roman warming and the best you'll get is incomprehension: the knowledge needed to assimilate and weigh the claim is simply not there.
What's needed to counteract this in the short term is something that can provide a nucleus of reasonable doubt: something that, while neither definitive nor even necessarily correct, is easy to understand and explain, looks sciency enough to appeal to popularizer egos - and yet casts sufficient doubt on the entirety of the climate change charade to embolden researchers. Notice, in this, that the method or ideas leading to it can be cheerfully inadequate as science because the media won't understand anyway and those who do understand will see it for what it is: the equivalent of calculations scribbled on a napkin - intended and effective only as an intellectual counterweight to the self-doubt mob pressure relies on to prevent good people from investigating further.
It's obvious what this can't be: most of the public, and certainly the guardians of right think, live in the now, so pointing out that no major estuary settlements anywhere drowned during the medieval warming period will not resonate with them; showing that the surface temperature record has been wildly corrupted just invokes an ad hominem response; and asking them to think through the reality that people from Canada and the northern tier states go to Arizona and Florida, not the Arctic, for holidays simply requires too much from them.
An idea that can probably be explained to media types and may create enough doubt to free researchers to raise more complicated issues among themselves is based on simple highschool science: if you heat a gas, its volume and/or containment pressure increases. Basically, since weather occurs in the troposphere, climate change should show up as some combination of pressure and volume change in the troposphere - and, because atmospheric pressure change is continuous (because an artifact of gravity rather than containment) you'd expect almost all of the sensitivity to temperature to express as changes in volume.
Radiosonde (weather balloon) data on this exists and is made easily available in only lightly edited form by the National Oceanic and Atmospheric Administration for about 2778 locations around the world (concentrated, of course, in areas of interest to civil and military aviation) with some of it going all the back to 1905.
So the lunch napkin scribble goes like this:
- download a cumulative 1.5 Billion or so individual records from the NOAA site;
- extract the available information on the altitude (base of the tropopause) at which the recorded temperature stops falling;
- merge the data from all stations by date to get an average altitude, more or less worldwide and for every day since at least 1950, at which this happens;
- perform broadly the same steps for pressure at either some standard altitude or averaged across the record for each ascent;
- graph the results and look at them.
The predictions, of course, are that average pressures should not change significantly over time and that the altitude at which the temperature stops falling should track both seasonality and climate change to show a long term increase if global warming is real and no increase if it's not.
Although there are quite a lot of things wrong both with this approach and its implementation here, the volume of data essentially overwhelms many of these problems with respect to the simple yes or no answer on warming we're looking for - and, indeed, what we get is a picture suggesting that nothing of unusual significance is going on with respect to either pressure in, or to the expansion and contraction of, the troposphere, and thus with respect to global warming or cooling.
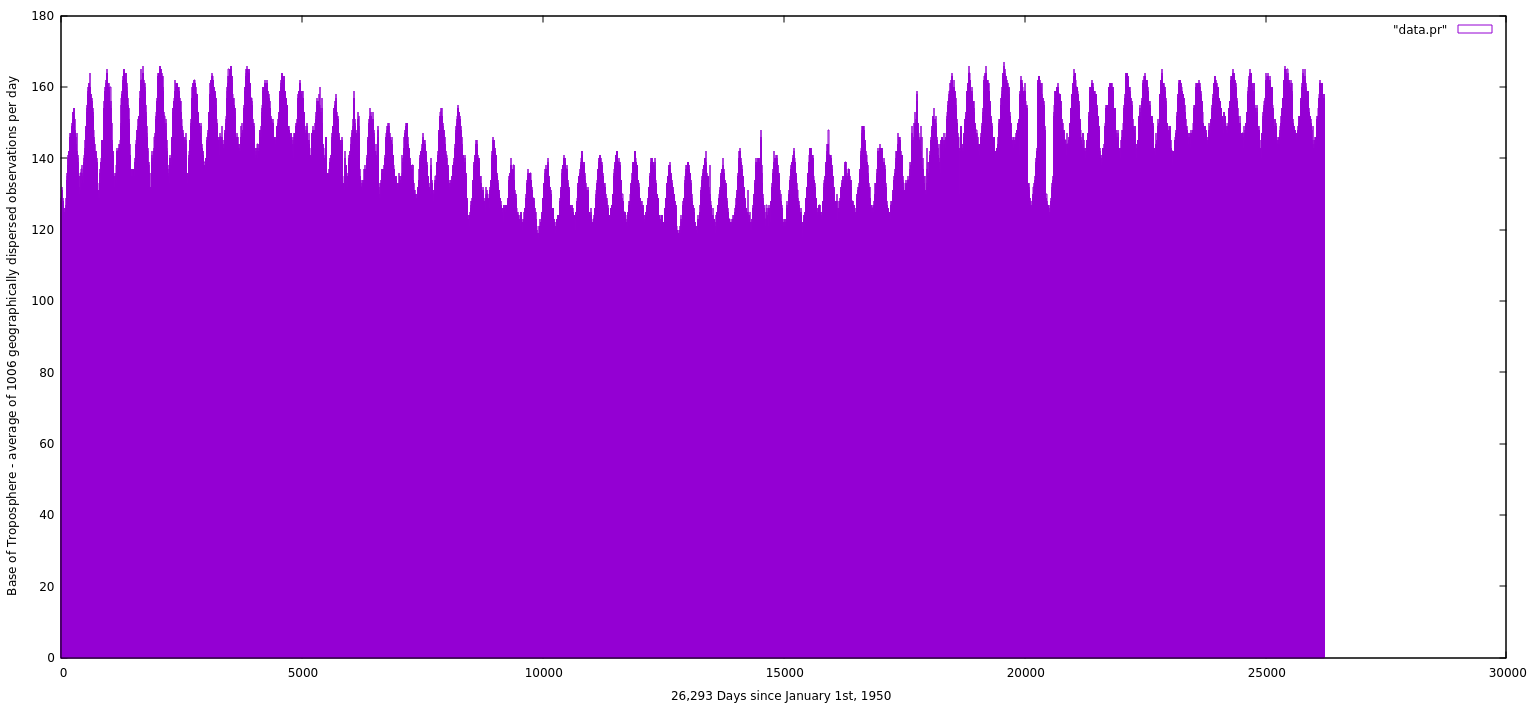
Note: this graph is extremely compressed. There are 25,666 data points along the X-axis and an average of about 1006 observations (Y-Axis) per day.
Zooming in 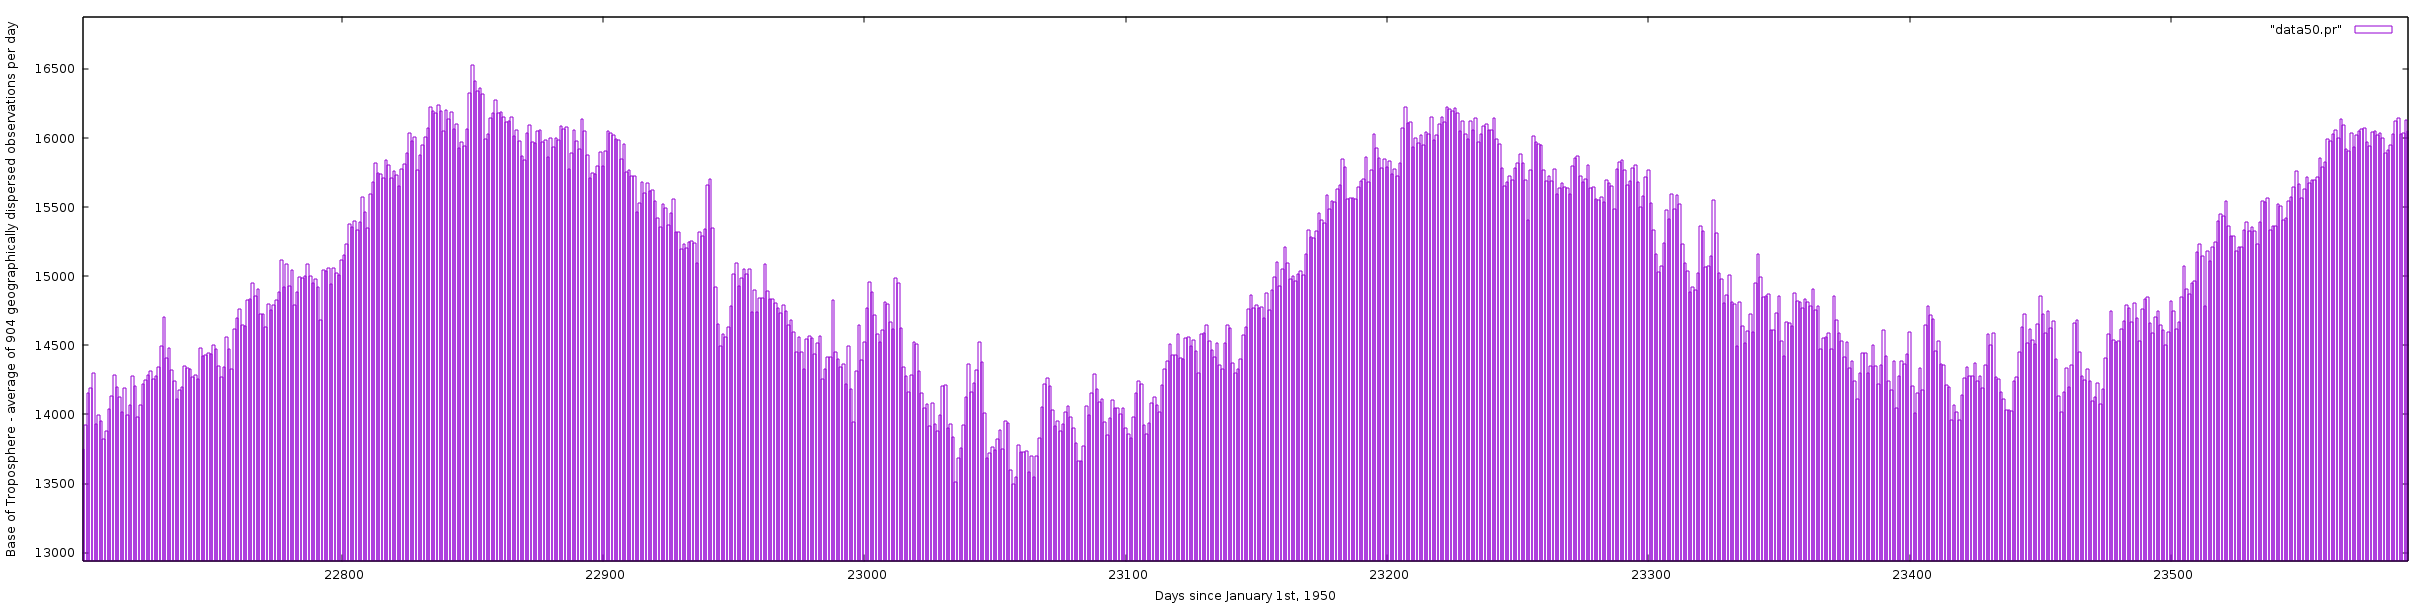 misses the point: it's the stability in the 70 year picture that matters.
Bottom line? Nothing: the climate change emperor is clothed in money and politics, but not fact: you can see a bit of truth to the 60s panic about cooling and the origin of 80s worries about warming; but overall no extended warming and no extended cooling: just Gaia going about her business as usual in complete accordance with known long and short term temperature fluctuations and what's actually known to science about the role of CO2 and water vapor in the atmosphere.
Two Notes:
What I'm doing here is admittedly simple minded: literally done first on a borrowed linux laptop over lunch - sort-of-global averaging for each day using a single change for each test to produce a gross, and geographically nonsensical, but consistent, global approximation.
To do the work I wrote a quick and not excessively complete script to process the data. To reproduce my result, get the data from NOAA and the script I used from this page - and, yes, I know: sh/awking, but I'm old and can write awk, but not Perl, while eating and talking.
- Log in to post comments
Comments
update Aug 22/22
Re-ran everything -code still works! - running a simple regressions of days 1 -->27671 (from1946) to today for US stations only now produces a tiny negative slope but other world wide results have not changed.